EU cereal producer and trader
Context: A global temperate cereal producer and trader with headquarters and primary operations in the European Union is preparing for mandatory climate risk disclosure from the European Union’s Corporate Sustainability Reporting Directive (CSRD).
In preparation for this disclosure, the Chief Financial Officer (CFO) has assembled a team to conduct climate scenario analysis, identify material climate risks, and generate a corresponding CSRD report that will also inform voluntary CDP reporting. The team decides to use the WBCSD Climate Scenario Tool.

Selecting scenarios
Based on CSRD Guidance, the team selects three scenarios that represent a wide range of futures in the commodity production and trading industry:
>3°C Historic Trends Scenario
A scenario that mirrors historical trends
<2° Forecast Policy Scenario (IPR)
A high conviction scenario that captures meaningful action towards curbing global warming, including through moderate greenhouse gas (GHG) prices, land protections, and scale up of bioenergy with capture and storage (BECCS).
1.5°C Innovation Scenario
A high ambition scenario that reflects greater-than-historic yield growth and public investment in innovation on top of greenhouse gas prices, land protections and significant scale up of bioenergy with capture and storage (BECCS).
The tool in use
Extracting what’s most relevant
The company tasks an analyst to start by comparing each of these scenarios against their in-house views on dietary shifts. The analyst finds that the >3° Historic Trends Scenario is largely aligned with their ten-year projections, and thus provides a useful baseline to assess the accretive impacts of climate transitions. The analyst also chooses the <2° Forecast Policy Scenario (IPR) and 1.5°C Innovation Scenario to represent a realistic policy future, and an ambitious technology-driven transition, respectively.
After selecting these three scenarios, the analyst uses the Climate Scenario Tool to understand price, production and regional variation in temperate cereal commodities under climate transitions.
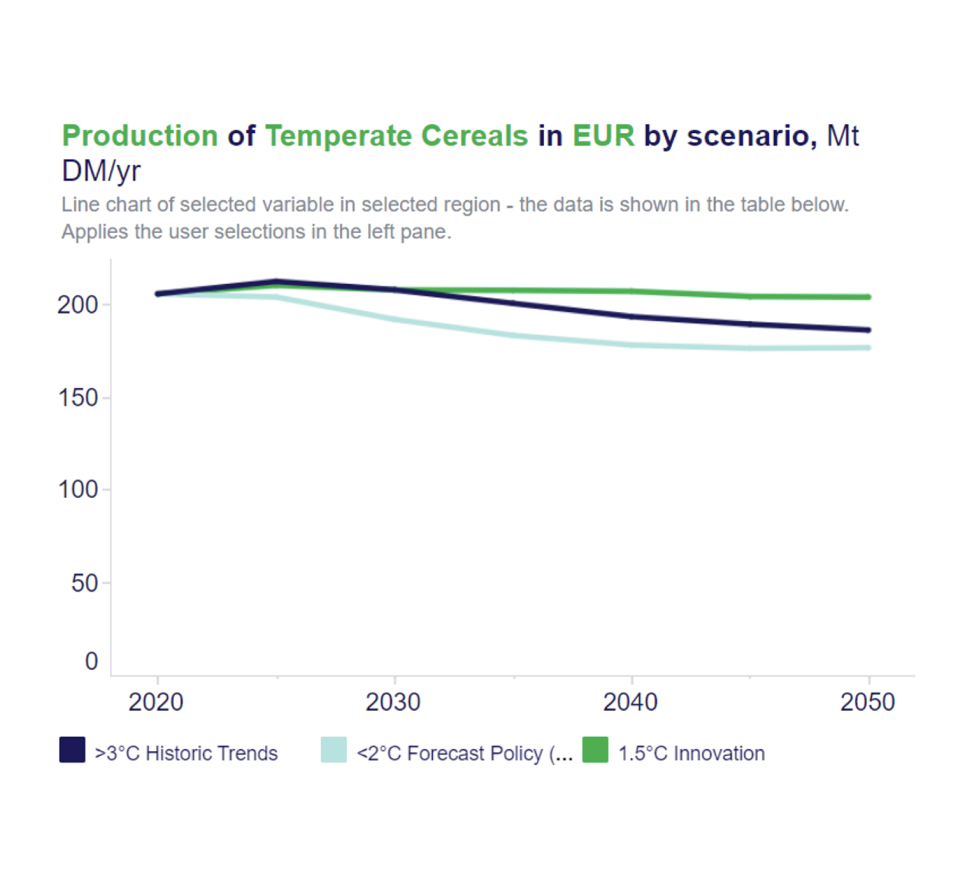
First, the analyst looks at total production of temperate cereals in the EUR region under the three chosen scenarios and notices a gradual decline across scenarios except the 1.5°C Innovation Scenario. By looking at the “Key Insights” button (top right hand side) within the Climate Scenario Tool, the analyst understands that this deviation can be explained by the rapid rise in yields under that scenario, buoyed by government and other investment in R&D.

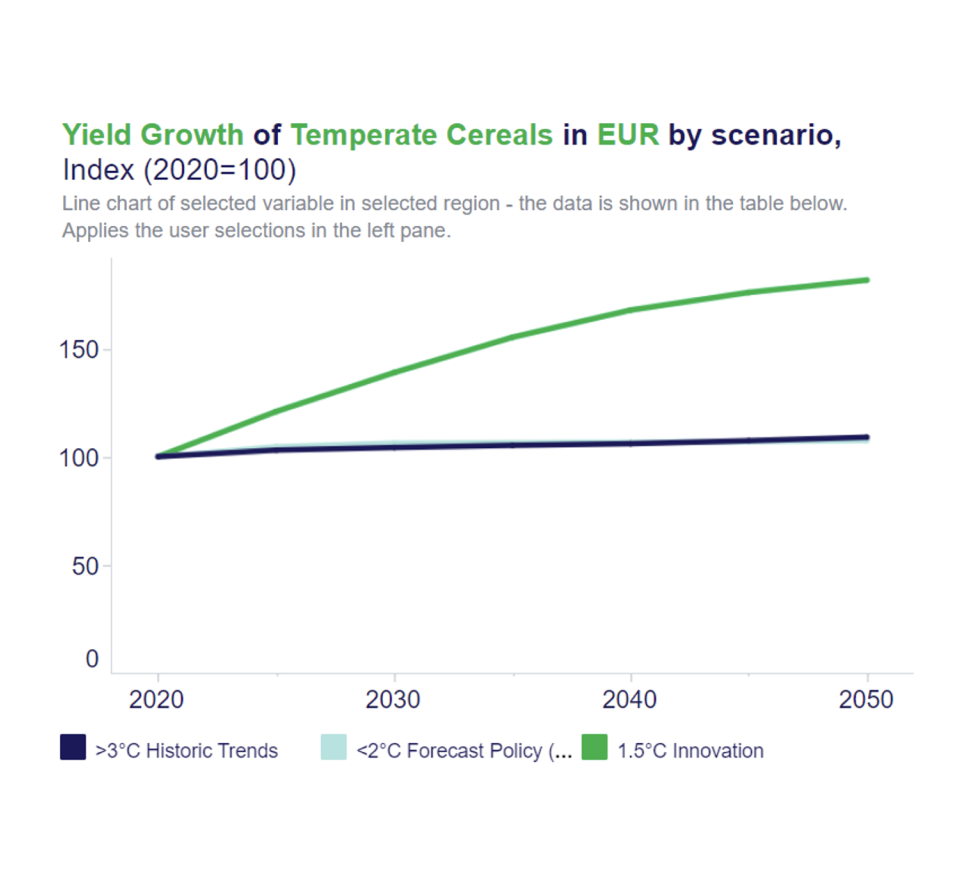
Based on this guidance from the “Key Insights,” next, the analyst looks at crop yields for EUR temperate cereals to better understand how this driver affects total EUR temperate cereal production.
The analyst notes that the crop yield for temperate cereals in the EUR region remains largely unchanged under the >3oC Historic Trends Scenario and the <2oC Forecast Policy (IPR) scenario, while the 1.5oC Innovation Scenario is connected to a significant increase in crop yields, validating the guidance from the “Key Insights” document.

What are the implications?
These trends suggest potential implications for the company based on their specific characteristics, market position, and strategic goals:
Analysis
The analyst begins by estimating how yield and revenue might change under each scenario. To do this, the analyst starts by downloading production, price, and yield data for temperate cereals under each scenario and determines the percentage difference for price and production under each scenario. She compares the changes in profit with the <2° Forecast Policy Scenario (IPR) and the 1.5C° Innovation Scenario to the >3° Historic Trends Scenario, which acts as a baseline. She then applies the percentage difference for yield, production, and price to in-house yield, revenue, and costs projections to analyze how yields and revenue might change under each scenario.
Next, the analyst decides to calculate the potential increased cost to the company due to GHG pricing policies under the three scenarios. The analyst first downloads the GHG price data that is a key driver of the three scenarios. Next, she multiplies the 2030 and 2050 GHG prices by the company’s emissions for each business segment to calculate the increase in costs for the company if they keep their carbon emissions constant for all scenarios. Then, she compares the changes in revenue to the increased cost of GHG prices to find how profit could shift under the three scenarios. Interestingly, the 1.5°C scenario, which has the highest transition risk in general of the three scenarios, would have the highest overall revenue of the three scenarios, but the lowest profits if carbon emissions remain the same.
Outcome
The analyst and the broader climate disclosure team conduct an entire climate scenario analysis and quantification of the different scenarios’ costs and opportunities to identify material risks to report for the EU CSRD disclosure. Although their original goal was simply to comply with the regulatory standards, during the climate disclosure process they were also able to identify potential future growth areas for the company as well as areas to mitigate risks.
