US meat processor
Context: A U.S.-headquartered, multi-national meat processor is asked by one of its investors to assess how climate transitions might impact the company’s revenues and costs. The company’s Chief Risk Officer (CRO) has meanwhile assembled an internal climate risk and disclosure taskforce to prepare for potential mandatory climate financial disclosure requirements in both the US and EU.
The CRO asks her team to identify a set of scenarios for analysis. An analyst on the team finds the WBCSD Climate Scenario Tool and starts using the Data Explorer to understand transition impacts on animal protein commodities, including poultry and beef, and feed, including maize and soy.

Selecting scenarios
Following the Taskforce for Climate-related Financial Disclosures (TCFD) guidance, she selects three scenarios that represent a wide range of societal pathways, to assess related business impacts:
>3°C Historic Trends Scenario
A scenario that mirrors historic trends.
<2° Forecast Policy Scenario (IPR)
A high conviction scenario that captures meaningful action towards curbing global warming, including through moderate greenhouse gas (GHG) prices, land protections, and scale up of bioenergy with capture and storage (BECCS).
1.5°C Innovation Scenario
A high ambition scenario that reflects greater-than-historic yield growth and public investment in innovation on top of greenhouse gas prices, land protections and significant scale up of bioenergy with capture and storage (BECCS).
The tool in use
Extracting what’s most relevant
The Climate Scenario Tool allows users to view business-relevant outputs such as commodity price and production globally and regionally, across five transition scenarios.
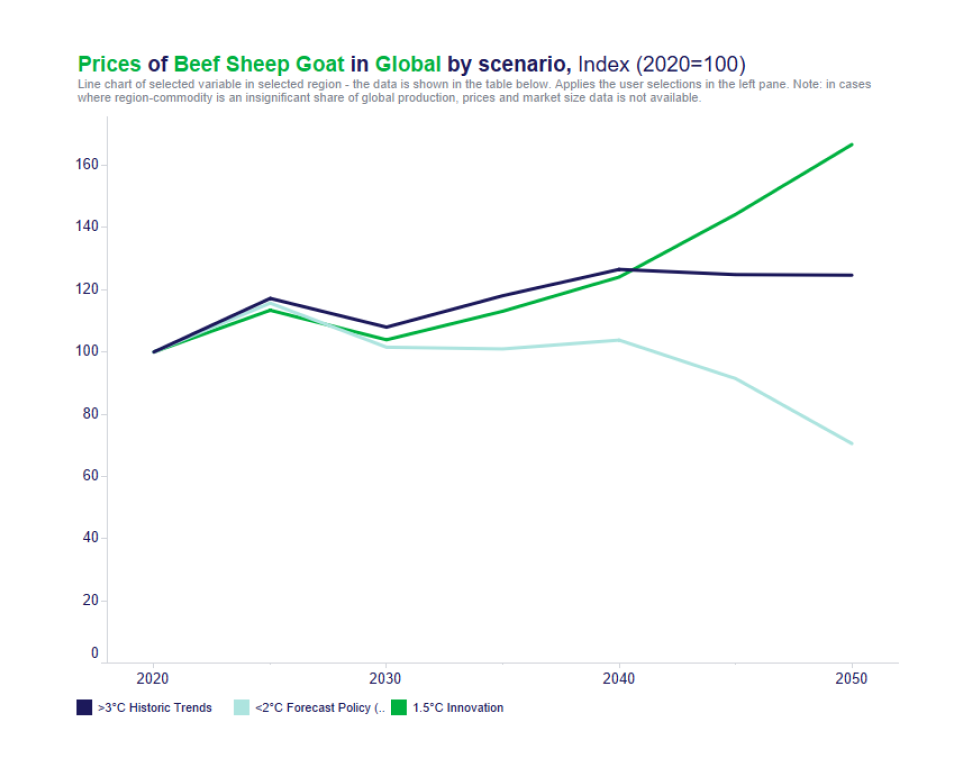
The analyst starts to explore the Climate Scenario Tool, first looking at how the price of ruminant meats, including beef, moves across the transition scenarios relative to the Historic Trends scenario.
She then sees that global price trends diverge over time across the scenarios. In all but the <2oC Forecast Policy (IPR) Scenario prices rise relative to today, driven by increasing demand for proteins. She wants to better understand what assumptions and dynamics are driving these differences and so she clicks into the “Key Insights” link within the Climate Scenario Tool (top right side of the Tool). In this document she learns that the <2oC Forecast Policy (IPR) Scenario’s assumptions around moderate dietary shifts but delayed and higher GHG prices explain its divergence relative to other scenarios.

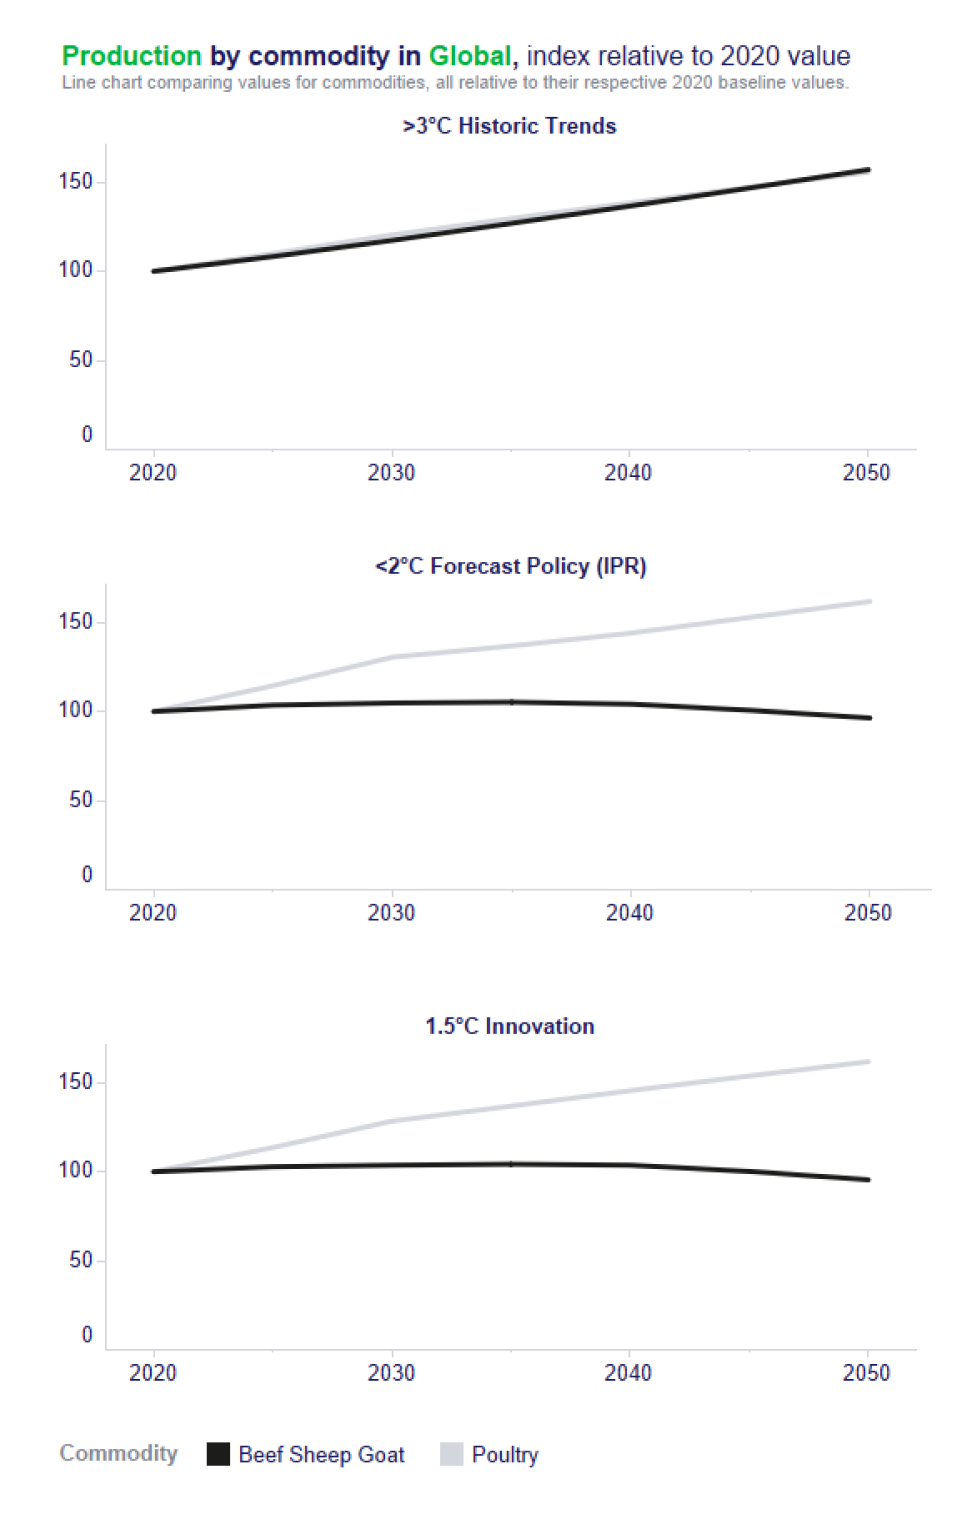
She then starts to explore whether price trends mirror production trends across different animal proteins. Specifically, she compares the production trajectories of both poultry and beef using the “Compare” feature (top right of Tool). Across all transition scenarios beef production is substituted with less emissions-intensive poultry production, driven by the introduction of greenhouse gas prices that raise production costs.

What are the implications?
These trends suggest potential implications for the company based on their specific characteristics, market position, and strategic goals:
Analysis
The analyst decides to assess scenario impacts on profits. She downloads price and production volume data for each segment of the business – including beef, pork, and poultry – under each scenario, and determines the percentage difference for price and production compared to the 2020 values. She then applies the percentage difference for price and production to in-house projections of revenue to analyze how revenues might change under each scenario. She uses the >3° Historic Trends Scenario as a baseline and then compares the changes in revenue with the <2° Forecast Policy Scenario (IPR) and the 1.5C° Innovation Scenario.
The analyst also estimates what the company’s carbon costs could be in the absence of emission reductions. To do so, she downloads the GHG price data that is a key driver of the three scenarios. She then multiplies the 2030 and 2050 GHG price by the company’s emissions for each business segment and for each scenario. Next, she compares the changes in revenue to the increased cost of GHG pricing to find how profits could shift under the three scenarios. Interestingly, the 1.5°C Innovation Scenario has the highest material impacts on net profit, though the impact varies significantly by protein segment.
Outcome
These findings are ultimately presented to the company’s executive team. The executive team realizes that they may have been thinking too conservatively about the potential for greenhouse gas pricing and alternative proteins; the company creates a special taskforce to explore alternative protein investment and assess the economics of feed additives to reduce methane emissions in cattle. The investor is excited to see new growth potential and asks the taskforce for frequent updates on capital requirements for expansion.
